Google Analytics Platform Overview

Google Analytics Platform lets you measure user interactions with your business across various devices and environments.

The platform provides all the computing resources to collect, store, process, and report on these user-interactions.

Platform Components

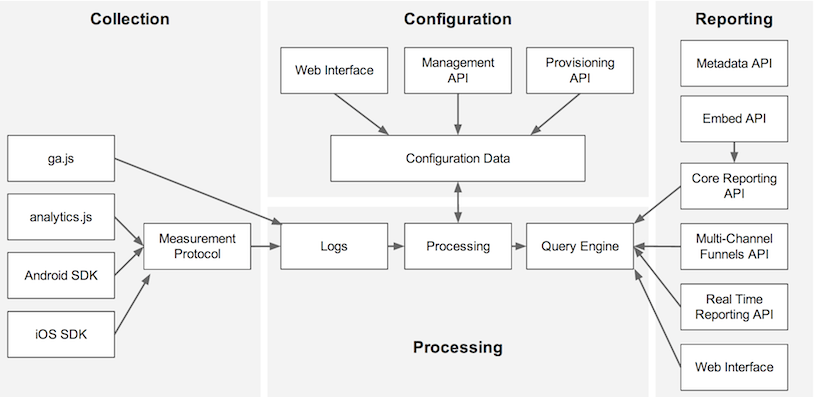
Developers interact and influence processing through a rich user interface, client libraries, and APIs that are organized into 4 main components: collection configuration, processing, and reporting. The following diagram describes the relationships between the components and APIs:

  • Collection – collects user-interaction data.
  • Configuration – allows you to manage how the data is processed.
  • Processing – processes the user-interaction data, with the configuration data.
  • Reporting – provides access to all the processed data.

Which SDKs and APIs to use

The following list describes which APIs you should use.

Collection

  1. Web Tracking (analytics.js)

    Measure user interaction with websites or web applications.

  2. Android

    Measure user interaction with Android applications.

  3. iOS

    Measure user interaction with iOS applications.

  4. Measurement Protocol

    Measure user interaction in any environment with this low-level protocol.

Configuration

  1. Management API

    Access configuration data to manage accounts, properties, views, goals, filters, uploads, permissions, etc.

  2. Provisioning API

    Create new Google Analytics accounts and enable Google Analytics for your customers at scale.

Reporting

  1. Core Reporting API

    Query for dimensions and metrics to produce customized reports.

  2. Embed API

    Easily create and embed dashboards on a 3rd party website in minutes.

  3. Multi-Channel Funnels Reporting API

    Query the traffic source paths that lead to a user’s goal conversion.

  4. Real Time Reporting API

    Report on activity occurring on your property right now.

  5. Metadata API

    Access the list of API dimensions and metrics and their attributes.

Article that brought Data Scientist to mainstream

Data has been useful to business for some time, and statistics and modeling techniques have always been useful for wringing value out of data. But what’s new is the greater size of data volume, and a greater diversity of data than there ever was before. Additionally, there is now a wide range of tools available to study data, from Hadoop to SAP to Tableau. “Data science” recognizes that there is a significant opportunity to combine some business functions that had not been combined in the past, and the people who will do this are Data Scientists.

‘Data science’ as a flag that was planted at the intersection of several different disciplines that have not always existed in the same place. Statistics, computer science, domain expertise, and what I usually call ‘hacking,’ though I don’t mean the ‘evil’ kind of hacking. I mean the ability to take all those statistics and computer science, mash them together and actually make something work.

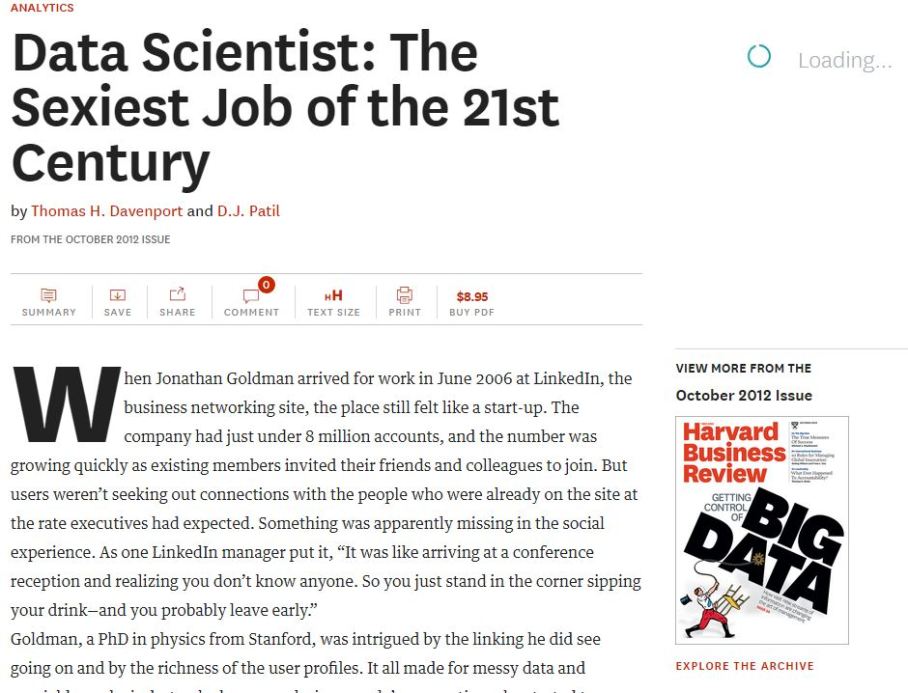
But make no Mistake that the term Data Scientist was brought to mainstream by the now famous Harvard Business Review article of Oct 2012. It is an amazing piece that traces genesis of how analytics products were started to be powered by Self Learning algorithms, and how an early LinkedIn employee was about to blow up whole new vertical of data centric innovation industry.

Capture

https://hbr.org/2012/10/data-scientist-the-sexiest-job-of-the-21st-century/ar/1

Some great Blogs about Data

As a data and Statistics aficionado I like to follow these blogs regularly, hope you may find them useful as well:

Popular Culture

Databases and Data Infrastructure

Machine Learning and Data Mining

Data Visualization

General Data Science

Developing a Big Data Strategy

If you are in technology field, you cannot hope to escape the noise surrounding big data.

The buzz is getting louder and the discussion has changed from “Big Data, a hype” to “Big Data, a challenge” in just about 12 months.  As put forward in many white papers and blogs written in the last 10 years, Big Data is definitely the new frontier of innovation and productivity growth, and for small and large businesses, private and public organisations, it has become imperative that Big Data is part of the overall business strategy

Now the question I get asked for companies is – how do we develop a Big Data Strategy?

I propose the following 6 steps (from an data analyst point of view):

Step 1: Comprehensive Data Inventory.

So I ask once again what is Big Data?  Big Data is all about data and we could group them into three:

  • Group 1: data that organisations have been collecting about their customers through billing, customer care, e-commerce transactions, emails, market surveys, and traditional sources such as ABS
  • Group 2:  those that are being volunteered on social media e.g. facebook and twitter
  • Group 3: those that global organisations e.g. Google, facebook,  Amazon, ebay have collected over the decade.

The first step at developing a Big Data Strategy is to fully understand what data the company holds.  For many organisations, potentially, this is the first time a comprehensive data inventory is being done and discovering what and how much data the company has, can be a big eye opener.  Focusing on customers, get hold of all customer related and data that can be linked to customers.  Undertake data mining and discover what your data shows, do data visualisation as it is easier to see both regular and unusual patterns visually. To do the data discovery and visualisation processes, it is advisable to hire a data scientist/statistician from outside the company for  two reasons: 1) for fresh set of eyes, free of internal biases and BAU processes and 2) to measure the statistical significance of observations.

Step 2: Strategic Business Requirements Gathering.

Data is used to inform business processes, decision, policy making and planning, therefore it is important to understand how the data is being used and who are the end-users. Go directly to the decision-makers, the C level executives, if you must, and you might find out that fundamental questions are being asked e.g. market share, price elasticity, customer value, customer profitability and correct market segmentation.  Map those questions and define your Question-to-Answer strategy – what are the key questions being asked and how can these questions be answered.  Would Group 1 data be sufficient to answer those questions or do you need to tap into Group 2, and Group 3?  This step will also determine what types of statistical modelling need to be developed,  which would ultimately define the type of software and infrastructure required.

Step 3: Existing IT Infrastructure and Software Inventory.

From learnings from steps 1 and 2, undertake IT infrastructure and applications inventory.  Evaluate if your existing IT capability is up to scratch with what you want to do with your data.  Your own IT department should be the source of intelligence for this exercise and if you have outsourced your IT, hire technology-agnostic consultants who are not only motivated to sell you their wares. The key point here is – don’t start buying new software and building new infrastructure until you have done steps 1, 2 and completed this step.  Chances are you have so many software and systems but you are not Big Data ready.  It is also possible that you have Big Data infrastructure in some form and depending on your business requirements – perhaps all you need is analytics capability to data mine, analyse and model. So potentially, you might only need to hire data scientists or statisticians who could work on structured and unstructured data.

Step 4: Build Business Case:

At this stage you should have gathered key inputs into your project business case – costs and benefits. Again, involve IT to design a prototype and from the above steps, determine your project cost.  Once project costs are estimated, compare that with expected benefits e.g. cost savings, productivity growth or revenue generation.  A strong ROI is the key to a strong business case to generate interests from potential sponsors.

Step 5: Develop Big Data Capability – Infrastructure, Metadata, Software, BI (Reporting).

This is the actual project management step which could potentially go between 12 to 18 months.  Spending the first 6 months developing an end-to-end prototype is going to be critically worthwhile and cost effective – even if you have to stop the project!

Step 6:  Build Analytics Capability (Hire). 

Hire data scientists/statisticians. Loop back to data discovery. Spend a lot of time on data discovery which might involve data cleansing and transformation. Once you have fully understood your data, then and only then can you construct implementable segmentation, develop behavioural models and perform predictive, decision, and policy analytics.


For more information on Big Data Strategies contact killerdatablog@gmail.com
 

Where will Social data take you

With the development of web technologies, an increasing amount of opinions are published online every day. People rely on the reviews more than before to help determine the quality of product in which they are interested.

I sometimes use the chatter data from Twitter.com to forecast box-office revenues for movies (see boxoffice.com)

The data that is being generated on the social networks as a result of human activities is commonly referred as Social Data. This is one of the largest streams of big data. The response observed during the Facebook IPO clearly suggest that social networking websites are going to witness unprecedented growth in the near future.

It is widely observed that these websites have become popular media for people to share their opinions, perceptions, attitudes, judgments, as well as personal happenings. Similarly, enterprises are leveraging this data for tracking their customers, analyzing their habits & behavior, marketing their products, measuring their competitive advantage, and improving customer relationship.

The rapid pace at which the social data is growing has made it critical for enterprises to unlock customer sentiment embedded in this big data stream. It is proposed that this will help them respond to customer complaints, improve their product quality. This highlights the importance of the field of Sentiment Analysis.

In plain terms, Sentiment Analysis is the extraction of linguistic and subjective information of opinions, attitudes, emotions, and perspectives. This can be further used to develop predictive models that can outperform market-based indicators. For example, a statistical model to predict the performance of movies at box-office can be developed by conducting Sentiment Analysis on movie reviews. This type of statistical models can considerably relieve the burden on people to self-analyze the huge amounts of reviews available in print and online.

However, Sentiment Analysis is not easy because terms have many context dependent meanings. In addition, most of the data that is currently available on the internet is unstructured and contains huge amount of noise, which needs to filtered-out before the data can be put to use. Another problem that is critically important is the fact that social data is being generated across different geographical locations. It is established in research that a person’s attitude, perceptions and opinion are significantly influenced by his/her environment, culture, religious beliefs, ethnicity and other sociology-economic factors.

Thus, I believe that social data has tremendous value associated with it and it can generate important insights which can be further leveraged for social and economic welfare. The domain of Sentiment Analysis is one of the areas that is set to expand exponentially in future, however, it remains to be seen how the associated hurdles are taken care of.

Principal Component Analysis

Data forms the core of any analytical exercise and it is often considered that the more data one has, the better it is! But is that always the case?

Consider, for example, an economic analysis or a modelling exercise with a large number of highly correlated variables. These correlated data points often have no marginal utility, that is, each additional variable serves a limited purpose on giving additional information, while the costs incurred in storing, modelling, and ensuring the accuracy of the model are a concern. So how do we deal with multivariate analysis in such situations? Is there any technique that can help reduce the number of data variables without loss of information?

The answer to the above question is a statistical technique known as Principal Component Analysis (PCA). Its application ranges from information extraction to dimension reduction and data visualisation.

The name PCA is attributed to the fact that it generates a set of factors called principal components, which are orthogonal (perpendicular) to each other (similar to the x, y, and z axes in the 3 dimensional Euclidean space). The variance of the data gets redistributed among the new components in such a way that the first principal component has the largest possible variance (accounts for as much of the variability in the data as possible) and each successive component has the next highest variance possible. The total number of components generated is equal to the number of original variables. However, for correlated variables, a majority of the total variance is explained by the initial few components, and hence it suffices to use just these few principal components

Let us understand the concept with the help of an example. Assume that you have 10 different variables from which you are required to extract the most relevant information. Run PCA on these variables; this will provide you 10 components (FIG. 1). The result shows that the first 3 principal components were enough to explain 95% variability (instead of using all 10 components or variables); hence, the number of variables were reduced from 10 to 3 components with a mere 5% loss of information.

The example shown above helps us understand how PCA reduces dimensionality of the data, while it retains the variation (as much as possible) of the data set.  The loading (weights) so obtained  for each component defines the weight needed to be given to each variable (X1, X2, to X10) in order to be able to build the entire series historically.  A point to note is that you will still need all the variables X1 to X10 to build the factors; however, the input for any model will be a 3 PCA series rather than 10 variables. This can form the basis of further analysis or input for other techniques.

This blog does not delve deep into the mathematics of the technique, but focuses on the application of PCA across different industries. The technique can be implemented using standard packages (such as E-Views, SPSS, and Minitab) available in the market.

Applications of the PCA

One of the eminent features of PCA is its application in regression analysis to handle problems of multicollinearity[1]. The most commonly adopted approach for handling multicollinearity is the omission of some independent variables that are correlated (e.g., if X1, X2, and X3 are highly correlated, use only one of them). However, in this approach, there is a possibility of losing important information contained in the other variables. On the contrary, PCA aids in combining these correlated variables into one and helps in saving the degree of freedom.

PCA also finds application in almost all the areas of ‘quantitative finance’. Quant traders/analysts use this technique in varied ways to suit their roles and requirements. Portfolio and risk managers use it for weight allocation to different assets and to monitor the market risk of their portfolios. Other quant analysts use it to model the yield curve and analyse its shape, implement interest rate models, or model the volatility smile. PCA is widely used by equity traders to develop trading strategies.

The scope of PCA is not just restricted to quantitative finance, but to every sphere of the industry. For instance, data analytics firms use it to group the information and derive related patterns/structure for better insights, while biostaticians use it to validate the results of various medical tests conducted during an experiment. The technique does have limitations such as the inability of handling missing data, and it is not applicable if the relationship between the observed variables is not linear. However, due to its simple methodology, implementation, and interpretation of results, it is widely accepted and used across industries.

To know more about how you can use PCA, please write to info@mindstark.com


Killer Data

Hi All,

I am starting  my new analytics blog. KILLER DATA

Here I will post about prominent practices in world of Data, Web and Business analytics. From time to time I will be covering major developments and breakthroughs in world of Data Science and Machine Learning as well.

Sometimes I will post about startups, cases and projects I have been part of. Please do leave a comment about anything you want me to write about here.